
Live logs and resource usage for Docker apps
Read an app’s logs in the browser as they arrive, and see how much CPU and memory each app uses, without logging in to a server.
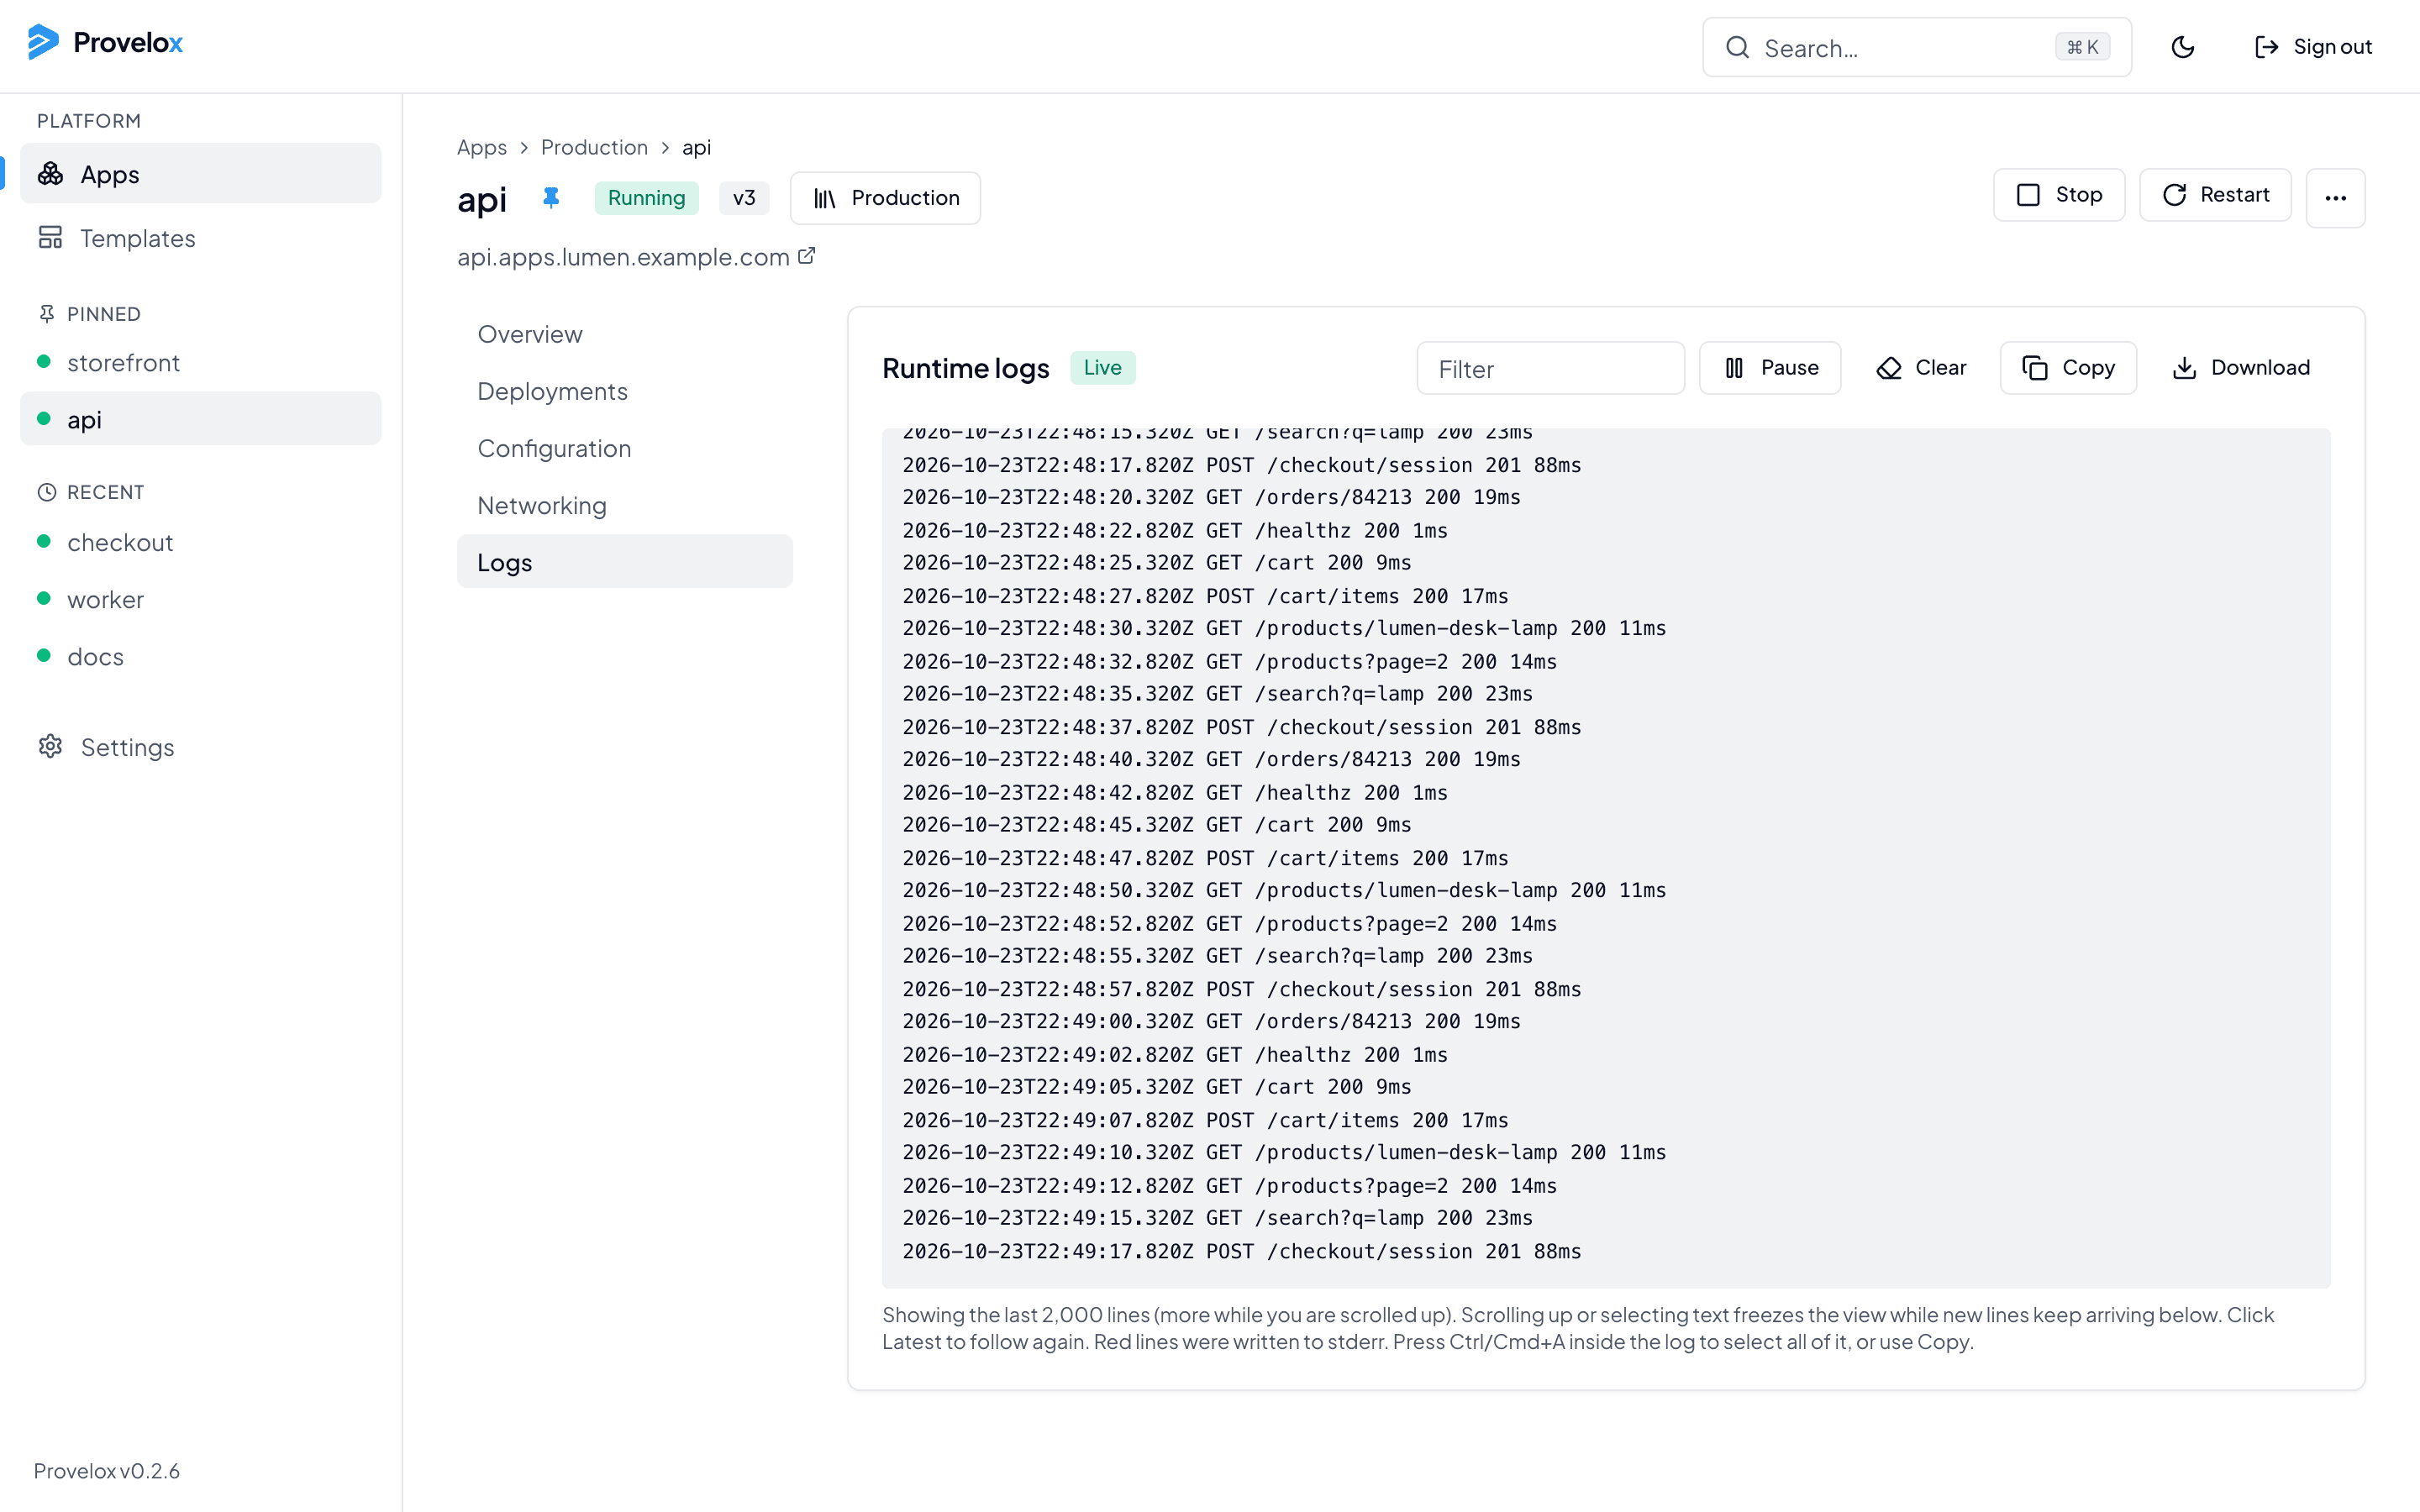
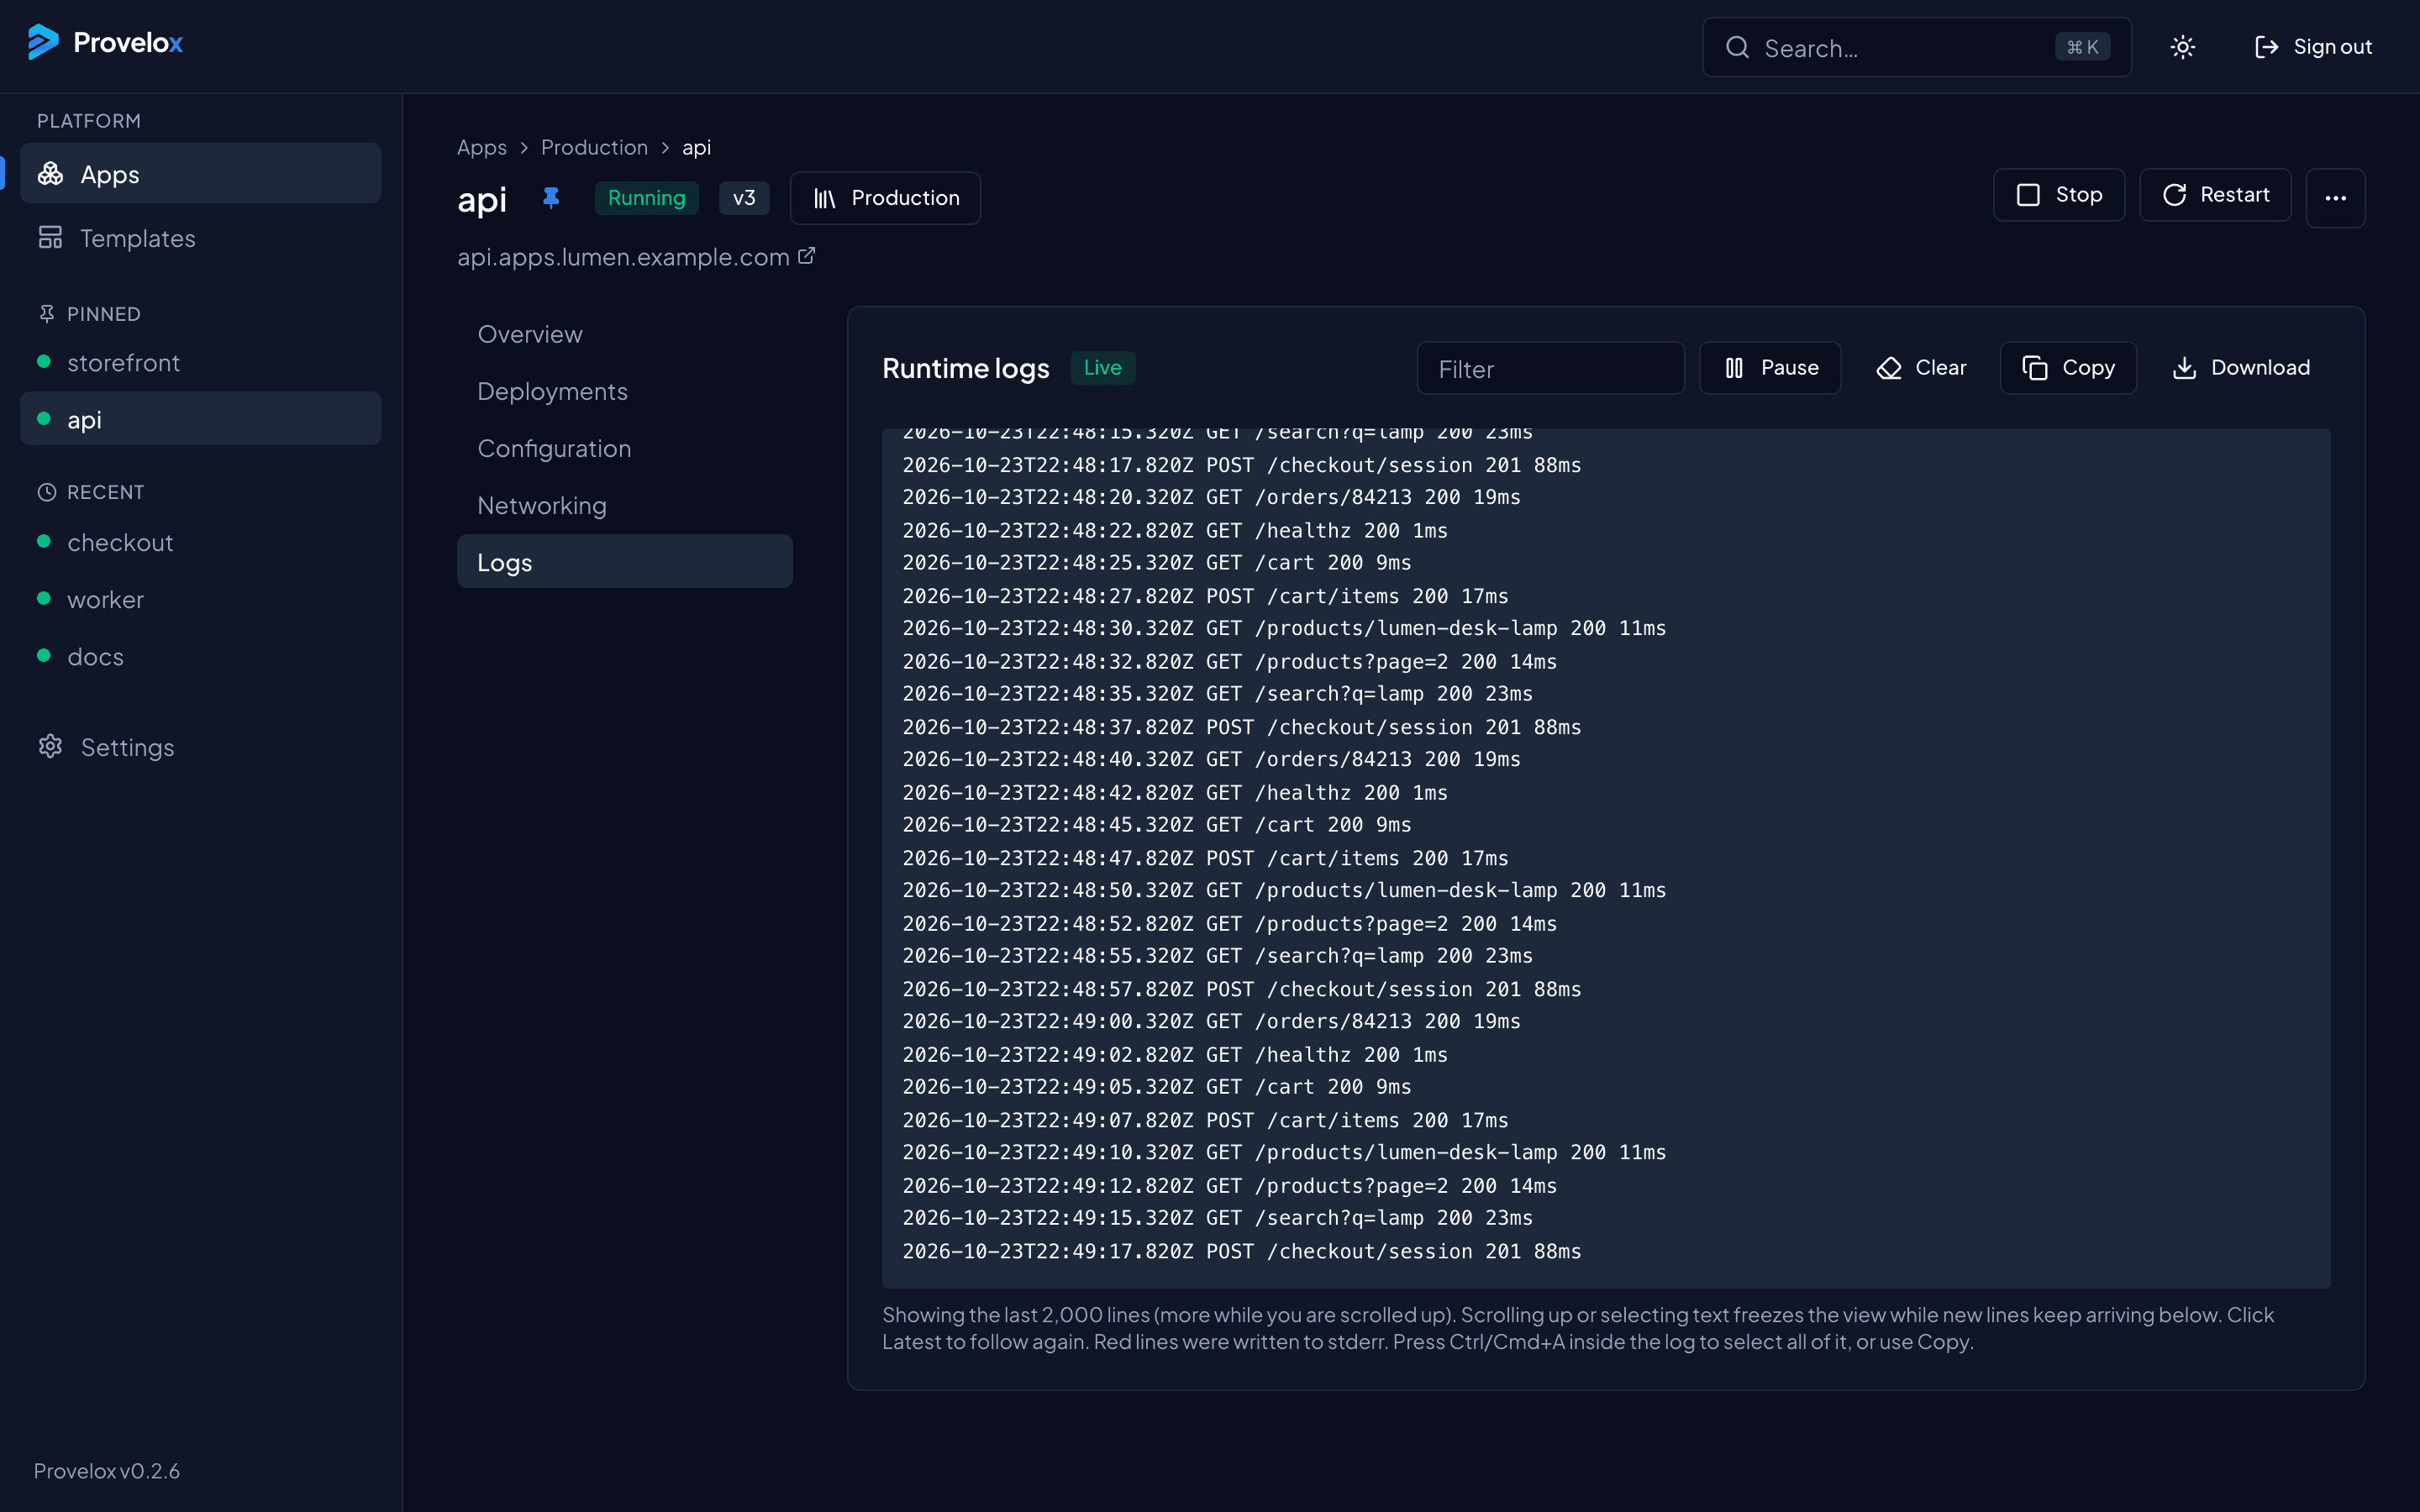
Logs in the browser
Stream an app’s logs as they are written, filter them, pause the stream to read, and download what you have. For a project, the logs of all its services are on the project page.
Usage at a glance
Each app shows its status, its instances, and a trend of its CPU and memory. The Apps page adds a summary on top: what is running, what is stopped, what needs attention, and how much of the cluster is in use.
Told when something is wrong
Set up notifications and Provelox tells you when an app or a server has a problem, so you do not have to be looking at the console to find out.
Questions about this
- Do I need a separate monitoring stack?
- Not to see whether an app is up, how much it uses, or what it printed. Those are in the console. For long-term metrics you may still want a dedicated tool.
- How long are logs kept?
- Logs are streamed from Docker, so they are as long as Docker keeps them for the container. The console does not store a second copy.